Tick Data Suite
Everything you need to make your Metatrader 4 backtests accurate, get 99% modeling quality and to immediately spot which expert advisor is worth your time.
Test your Expert Advisors using real data
Accuracy at Your Fingertips
Everything you need to get 99% modeling quality in your MT4 backtests.
The Tick Data Suite integrates seamlessly with MT4, making backtesting on real data as simple as checking a box.
There is no need to export data or manually manipulate files. Tick Data Suite handles everything behind the scenes.
Get free tick data from multiple quality sources.
The included Tick Data Manager Premium allows you to start downloads, configure the data range, enable spike filtering, view the details for each symbol and more.
Data is automatically processed using multithreading to take advantage of modern CPUs.
Accuracy at Your Fingertips
Everything you need to get 99% modeling quality in your MT4 backtests.
The Tick Data Suite integrates seamlessly with MT4, making backtesting on real data as simple as checking a box.
There is no need to export data or manually manipulate files. Tick Data Suite handles everything behind the scenes.
Tick Data Manager
Get free tick data from multiple quality sources.
The included Tick Data Manager allows you to start downloads, configure the data range, enable spike filtering, view the details for each symbol and more.
Data is automatically processed using multithreading to take advantage of modern CPUs.
Test your Expert Advisors using real data
Everything you need to get 99% modeling quality in your MT4 backtests.
The Tick Data Suite integrates seamlessly with MT4, making backtesting on real data as simple as checking a box.
There is no need to export data or manually manipulate files. Tick Data Suite handles everything behind the scenes.
Get free tick data from multiple quality sources.
The included Tick Data Manager Premium allows you to start downloads, configure the data range, enable spike filtering, view the details for each symbol and more.
Data is automatically processed using multithreading to take advantage of modern CPUs.
Accuracy at Your Fingertips
Everything you need to get 99% modeling quality in your MT4 backtests.
The Tick Data Suite integrates seamlessly with MT4, making backtesting on real data as simple as checking a box.
There is no need to export data or manually manipulate files. Tick Data Suite handles everything behind the scenes.
Tick Data Manager
Get free tick data from multiple quality sources.
The included Tick Data Manager allows you to start downloads, configure the data range, enable spike filtering, view the details for each symbol and more.
Data is automatically processed using multithreading to take advantage of modern CPUs.
All of your tick data in one place
The Tick Data Suite employs a proprietary compression algorithm that is both fast and efficient, outperforming all other financial data storage solutions.
The centralized repository eliminates the need to maintain duplicate data for each Metatrader 4 installation.

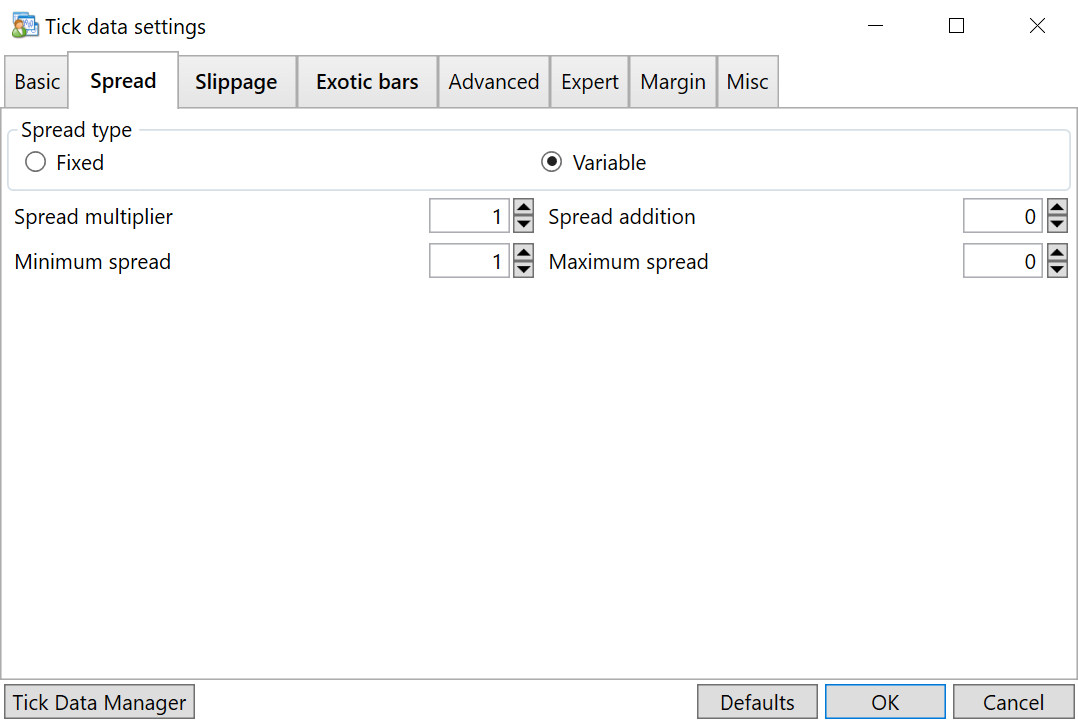
Real Spreads
Use the actual, variable spread that is recorded in the tick data.
Instead of backtesting with a fixed spread, you can now use the real bid and ask prices as they were recorded, challenging your EAs with the conditions encountered on live servers.

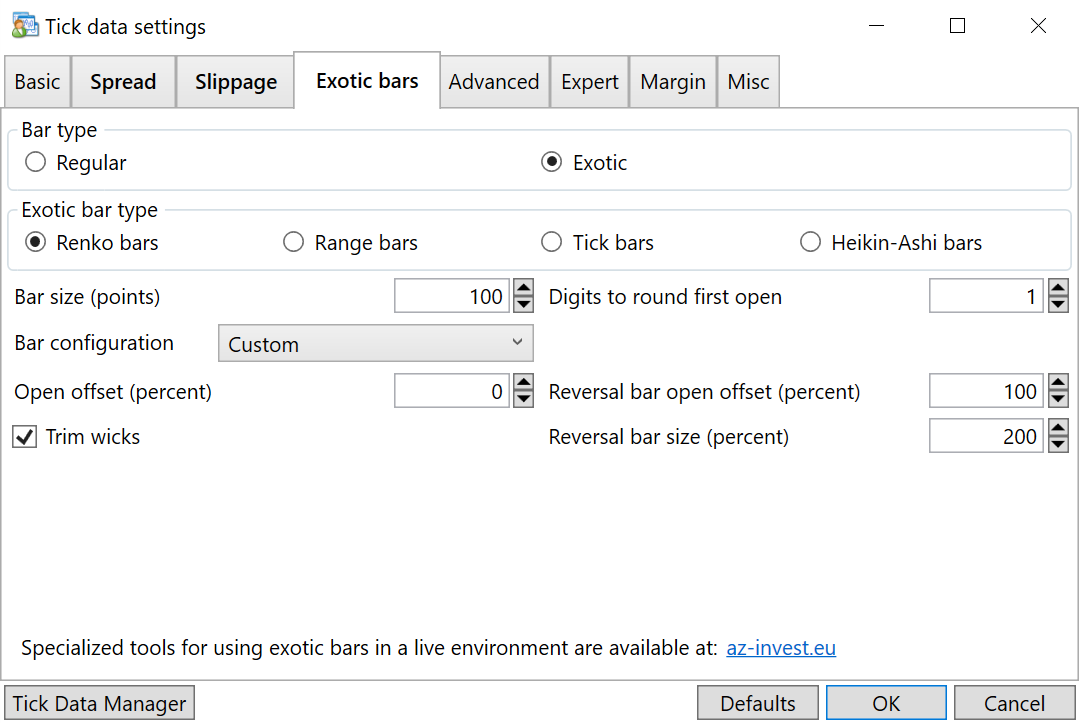
Exotic bars
Determine how your strategy works when using Renko bars, Range bars, Tick bars, or Heikin-Ashi bars.
You can configure your MT4 backtests to use exotic bars with a single click, then adjust the bar configuration to evaluate how well your EA performs.

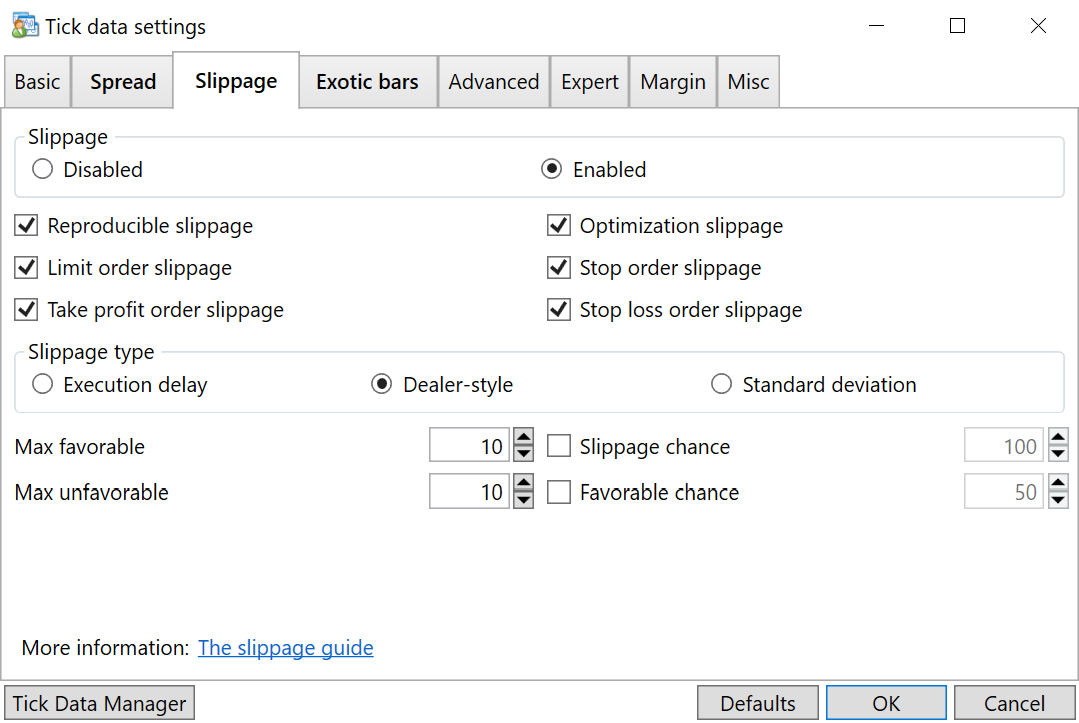
Simulate slippage
Want to ensure that your trading strategy can withstand the most challenging market conditions?
Tick Data Suite can assist you by introducing slippage into your backtests, which can be simulated in a number of modes with detailed configuration settings.
All of your tick data in one place
The Tick Data Suite employs a proprietary compression algorithm that is both fast and efficient, outperforming all other financial data storage solutions.
The centralized repository eliminates the need to maintain duplicate data for each Metatrader 4 installation.
Real Spreads
Use the actual, variable spread that is recorded in the tick data.
Instead of backtesting with a fixed spread, you can now use the real bid and ask prices as they were recorded, challenging your EAs with the conditions encountered on live servers.
Simulate slippage
Want to ensure that your trading strategy can withstand the most challenging market conditions?
Tick Data Suite can assist you by introducing slippage into your backtests, which can be simulated in a number of modes with detailed configuration settings.
Exotic bars
Determine how your strategy works when using Renko bars, Range bars, Tick bars, or Heikin-Ashi bars.
You can configure your MT4 backtests to use exotic bars with a single click, then adjust the bar configuration to evaluate how well your EA performs.


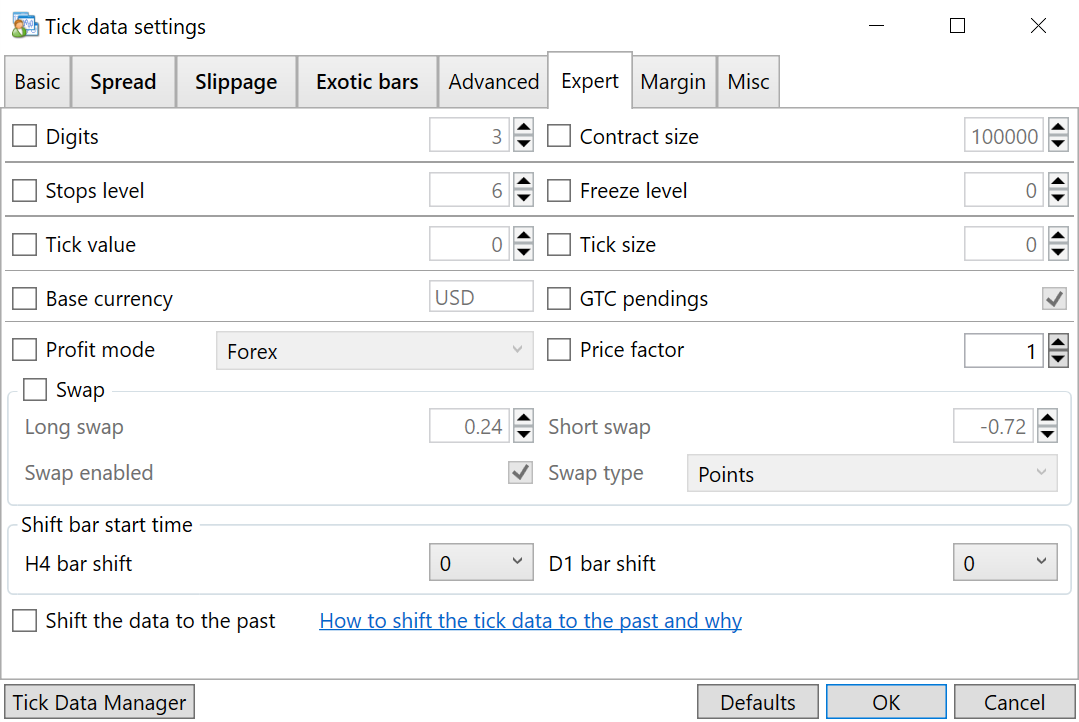
In-depth backtest configuration
√ Change the timezone of your backtests without complicated file creation.
√ Change the source tick data symbol to find EAs with hardcoded settings.
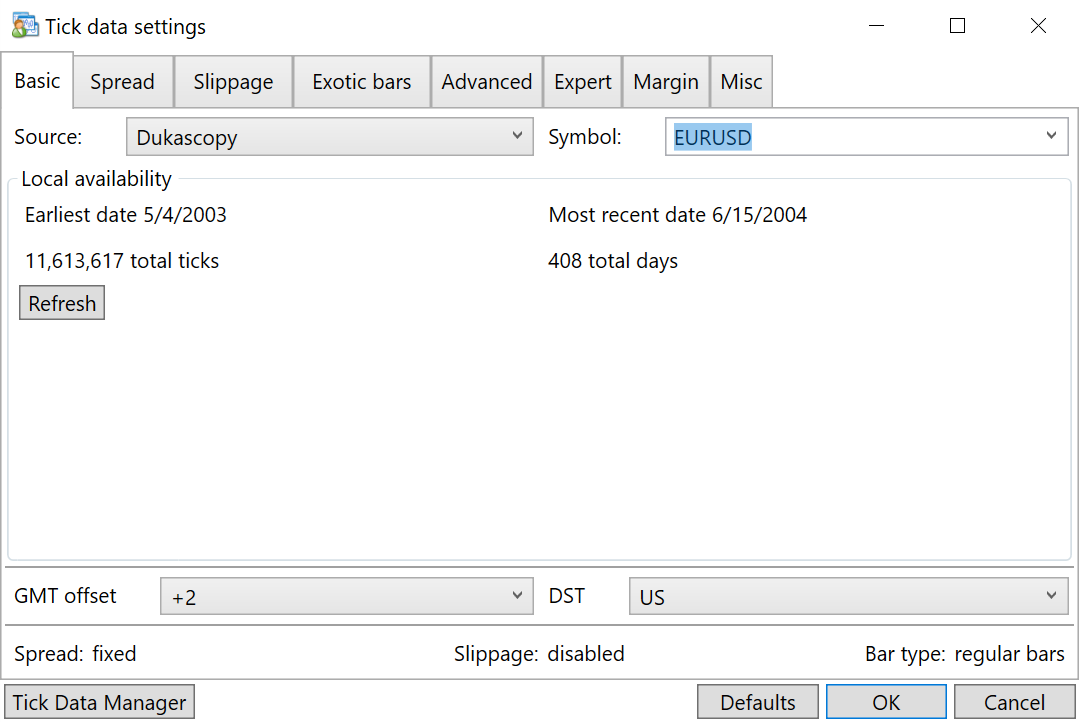
√ Use the real, variable spread stored with the tick data for the best backtest accuracy.
√ Adjust the spread to better fit the trading conditions of your broker.
√ Enable slippage to simulate even the most adverse conditions.
√ Choose between several methods of generating slippage.
√ Find out how your EA would perform in an exotic bar environment with a few clicks.
√ Choose between several exotic bar types that can be used in your backtest.
√ Use your default account environment or override any of the settings.
√ Backtest using different leverage, change the lot configuration or commission.
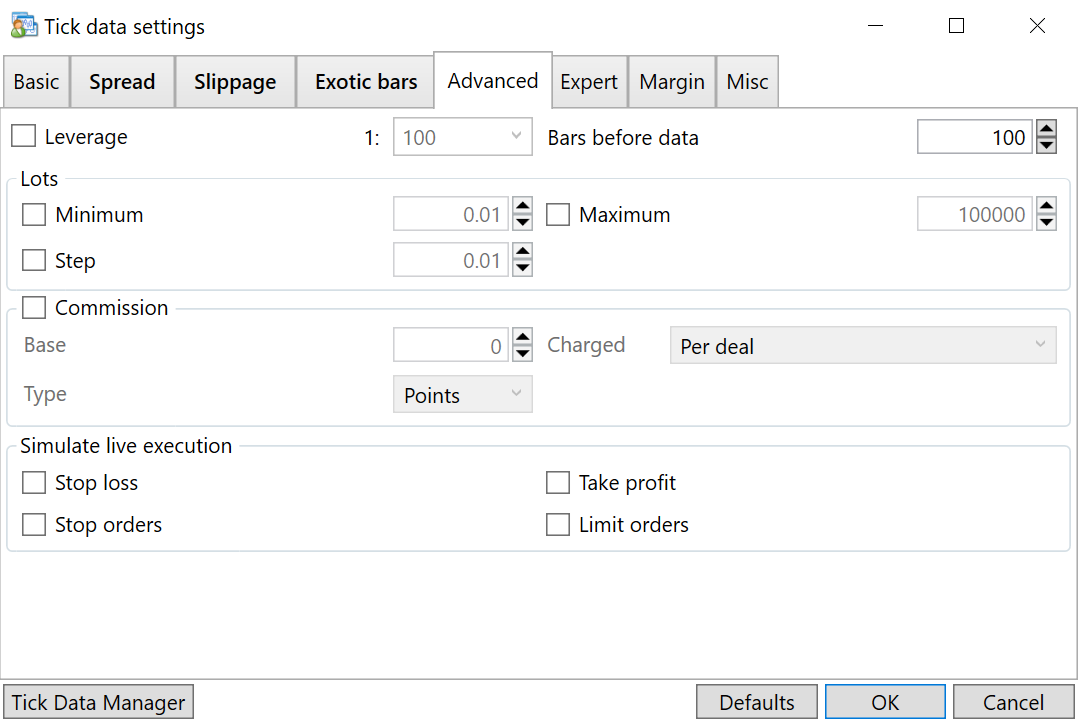
√ Expert settings to suit the needs of the most experienced EA users.
√ Shift data 28 years to the past to easily identify which EAs use hardcoded data.
Tick Data Suite
Trusted by traders for 15 years
Choose your plan
This product is a subscription that will automatically renew until cancelled.
- ✓All updates while subscribed
- ✓Pro-rated upgrade to any plan
- ✓No long-term commitment
- ✓No renewals, no price increases, ever
- ✓All future updates included, free
This product is a subscription that will automatically renew until cancelled.
- ✓Everything in Monthly
- ✓Save $261 a year
- ✓One simple yearly payment
Free Trial
Try the Tick Data Suite for 14 days
The trial license key will be delivered to your email address.
Need more information?
Visit our general FAQ
-
- The Tick Data Suite works with all Microsoft Windows operating systems that are currently supported by Microsoft (except ARM/ARM64 versions, please see the FAQ entry about this for more information).
- The following operating systems are not supported:
– Windows 7
– Windows XP x86
– Windows XP x64
– Windows Server 2003 x86
– Windows Server 2003 x64
– Windows Server 2008
– Windows Vista
– Any Windows OS released prior to 2001
– Any non-Windows OS, such as OS X or any other OS derived from Linux, BSD or UNIX
As a rule of the thumb, if Microsoft is not supporting your Windows version anymore, Tick Data Suite is not supported on it either.
-
- Windows versions that work with the Tick Data Suite but are not supported:
– Windows 7
– Windows Server 2008
– Windows Vista
The Tick Data Suite has been tested on the above operating systems and found to be working, although it’s important to note that these operating systems are not part of the rigorous testing undergone by each release. However, even though it may work, please be aware that should you choose to run it on any of the above operating systems, you are entirely on your own and must find your own solutions for any problems you may encounter.
- Tick Data Suite is a powerful software that enables backtesting of expert advisors in MetaTrader 4 using actual tick data. It consists of two components:
- The Tick Data Manager – enables you to download high-quality tick data from multiple sources, import existing data, or export data for other platforms.
- The MT4 integration module – eliminates the need to manually export data or manage files. Tick Data Suite performs all operations behind the scenes.
You can download tick data from:
- Dukascopy
- Alpari (ECN1, MT5, Nano, ProECN, Standard1, Standar2, Standard3)
- Histdata.com
- FXCM
- Bitcoincharts
- Rannforex
- Darwinex
- FxOpen
- TrueFx
All tick data is as recorded and provided by the respective broker. We do not own or sell the tick data nor do we assume any responsibility regarding the accuracy or availability of the data.
Dukascopy, Darwinex, TrueFx and FxOpen data is downloaded via our content delivery network which means you will be connected to the closest local source with a significant speed increase.
You will download data directly from the broker servers for Alpari, Histdata, FXCM, Bitcoincharts and Rannforex.
Tick Data Suite can only automatically download tick data from the brokers included by default.
If you would like to add a new source you will have to manually import the tick data from a .csv file.
Yes. The tick data can be imported from CSV files; Importing data includes an autodetection mechanism that figures out the file format automatically.
In addition, you can automate your import tasks by utilizing command line parameters.
Each license key is valid for a single machine. If you’d like to use the Tick Data Suite on multiple computers at the same time, you will need one license for each machine.
If you’d only like to move your license to a different computer, that is easily possible but not more often than every 7 days.
The Tick Data Suite only integrates with MT4. If you’d like to use tick data with other platforms, you can easily export it to .csv